50/30/20 Budget Calculator

Enter your monthly take-home pay and get your 50/30/20 split in dollars: needs, wants and savings — plus what each preset ratio means for your year.
How to use this calculator
Run the numbers once, write the result where you will see it, and let the free expense tracker do the weekly work: it sorts every entry into needs, wants and savings automatically, so drift from the plan is visible the moment it starts instead of at the end of the month. A calculator sets the target; tracking is what actually gets you there.
How to use the result
The three numbers are monthly ceilings, not suggestions: needs (rent, groceries, utilities, insurance, minimum debt payments) should fit inside the first number, wants (dining out, entertainment, subscriptions) inside the second. If reality exceeds a ceiling, that category is your one budget project for next month — the tracker’s three-bucket view shows exactly which entries pushed it over.
A worked example on $4,000
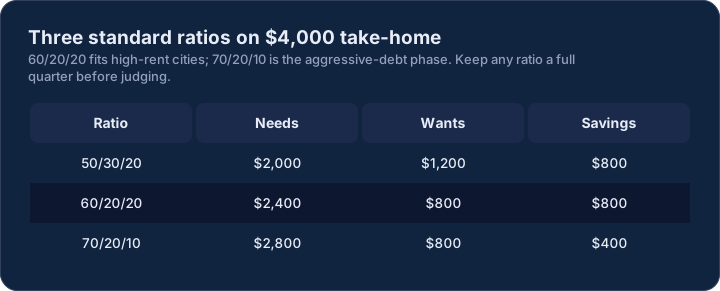
Run the balanced preset on $4,000 take-home and the split lands at $2,000 needs, $1,200 wants, $800 savings. Now the honest pass: rent of $1,340 pushes real needs to about $2,190 — $190 over the ceiling. The ratio picker turns that discovery into a plan instead of a failure: switch to 60/20/20, needs get $2,400 of room, and savings holds at $800 because both presets bank twenty percent. What actually shrinks is wants, from $1,200 to $800 — a deliberate, visible trade rather than a vague sense of failure. If even sixty percent cannot contain needs, the number to attack is the rent itself: a $190 monthly gap is a renegotiation conversation, not a latte conversation.
Choosing a ratio
50/30/20 is the default for a reason: it balances today’s life against future you. 60/20/20 fits high-rent cities where needs genuinely run hot — savings still moves forward while housing eats its share. 70/20/10 is the aggressive-debt phase: minimum survival, tracked wants, maximum payoff. Whichever you pick, keep it for a full quarter before judging — the first month is always noisy.
The number people forget
Savings percent matters more than savings dollars at the start: 5% automated on payday outperforms a 20% plan that relies on end-of-month leftovers, because leftovers get reabsorbed. Set the transfer the day you calculate; the calculator’s yearly figure is what the habit compounds to.
Reading the comparison table and the needs caps
Below the split, the calculator lays the three standard ratios side by side on your actual income — needs, wants, savings and the yearly savings figure for each. Read it as a menu of trade-offs rather than a ranking: the 70/20/10 row is not “better”, it is a different season of life with a price tag on the wants column. The needs caps underneath (housing 55%, food 25%, transport 12%, utilities and phone 8% of your needs budget) exist to answer the follow-up question the total cannot: if needs bust the ceiling, which line inside it is the culprit. Rent eating 65% of needs is a move-or-renegotiate problem; groceries eating 35% is a meal-plan problem — same overage, completely different fixes.
Frequently asked questions
Is this before or after tax?
After — take-home pay only, or every ratio breaks.
Does 20% include my 401(k) deduction?
Yes — count payroll deductions into retirement as part of your 20%, since that money is saved before it ever reaches you.
What if my needs are 70%?
That is a housing/transport conversation, not a coffee conversation — the calculator’s gap view makes the case for the big levers.