Expense Categories: The Complete List for Your Budget

The right category list turns tracking from data entry into insight — eight core buckets, and when to split them further.
Why categories matter more than budgets
A budget with no categories is just a total — and a total tells you nothing about what to change. Categories turn "I spent $3,200" into "rent is fixed, food crept up $80, fun doubled." The category layer is where data becomes decisions, which is why getting the buckets right is the first real step of any budget.
The eight core categories
Housing & Rent (rent, insurance, repairs), Food & Groceries (supermarkets; delivery gets its own line if delivery fees surprise you), Transport (fuel, transit, rideshare, parking), Utilities (power, water, internet, phone), Entertainment (streaming, games, nights out), Health (pharmacy, appointments, gym), Shopping (clothes, electronics, home), Other — reviewed monthly, because a growing Other means the buckets need work.
When to split a category
Split when a bucket is both large and actionable. Food at 25% of spending → split restaurants out; delivery fees are usually the surprise. Transport at 5% → do not bother. The test: would this change a decision this quarter?
Subscriptions earn their own line
Recurring charges are the most common leak — a dedicated subscriptions bucket makes them visible every month even though they could technically live inside Entertainment.
The Other category is the canary
Other is not a junk drawer, it is a smoke alarm. A healthy month keeps Other under about 3% of take-home; the moment it starts climbing, the buckets have drifted out of date — a new regular expense nobody categorized yet, or a merchant name too vague to sort. Review Other’s entries first every month, and when the same kind of purchase shows up three times, it has earned its own line in the taxonomy. Categories are supposed to be maintained like that: grown by evidence, not by planning ahead for every possibility.
Healthy shares of take-home
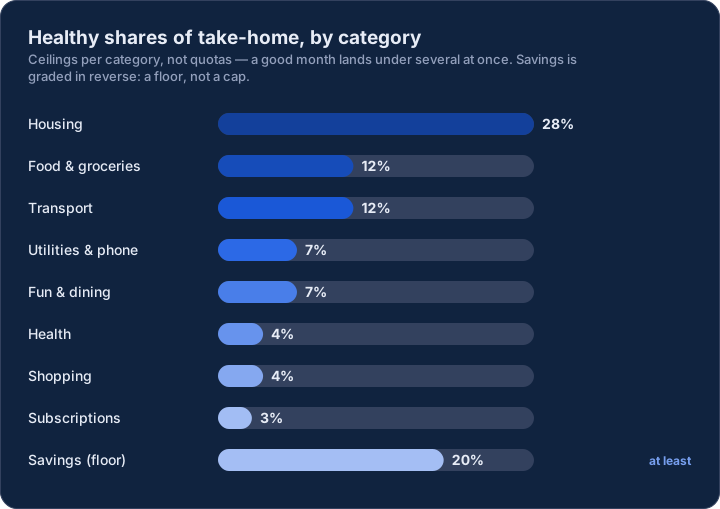
Categories earn their keep when they carry a judgment: a healthy share of income to compare your month against. Housing up to 28% of take-home, food 12%, transport 12%, utilities and phone 7%, fun and dining 7%, health 4%, shopping 4%, subscriptions 3% — with savings graded in reverse, at least 20%. On $4,000 those caps become $1,120 of housing and $480 of groceries, numbers you can check a receipt stack against. The caps are ceilings, not quotas: a good month lands under several at once, and the money that frees up is exactly where savings above 20% comes from. The budget health check grades a real month against this table automatically.
| Category | Healthy share | On $4,000 / month |
|---|---|---|
| Housing & rent | up to 28% | $1,120 |
| Food & groceries | up to 12% | $480 |
| Transport | up to 12% | $480 |
| Utilities & phone | up to 7% | $280 |
| Fun & dining | up to 7% | $280 |
| Health | up to 4% | $160 |
| Shopping | up to 4% | $160 |
| Subscriptions | up to 3% | $120 |
| Savings (floor, not cap) | at least 20% | $800 |
Frequently asked questions
How many categories should I use?
Eight to twelve: more creates unreadable data, fewer hides patterns.
Where do pet costs go?
Own line if pets are 5%+ of spending; otherwise Health or Other.